


Vero, developed by Oxford Instruments Asylum Research, is a next-generation atomic force microscope (AFM). Building on its flagship Cypher AFM platform, Vero is the first AFM to utilize a patented1 Quadrature Phase Differential Interferometry (QPDI) detector, providing unparalleled performance while maintaining range, accuracy, and noise.
This article explores the historical background of AFM detection methods, outlines the design and technical specifications of the new Vero AFM, and describes how Vero AFM’s high standards for accuracy and noise will empower the next generation of AFM scientific research.
Historical Background
Shortly after the introduction of the AFM2 in 1986, researchers explored various approaches to cantilever detectors. Many of the initial designs3–8 relied on interferometric detection.
These systems typically demonstrated effective noise performance, benefiting from the inherent calibration reference: the wavelength of light. However, their complex designs and other performance drawbacks hindered their widespread applications.
In a simple Michelson interferometer, depicted in Figure 1, the detection range is constrained to cantilever displacements considerably smaller than the wavelength of light. This limitation arises because the resulting sine wave signal is only linear around zero, and the signal diminishes at the sine wave’s peak and trough.
As the reference mirror is usually distant from the cantilever, this method may be susceptible to noise. This is particularly true at low frequencies due to drift and vibrations between those components.
Figure 1. A simple Michelson interferometer has several limitations. Among them, the output is sinusoidal, and therefore only linear across a small fraction of the wavelength of light. Also, any vibration or drift occurring in either the measurement or reference beam causes noise in the measured cantilever displacement signal. Image Credit: Asylum Research – An Oxford Instruments Company
While more intricate interferometric designs were actively tackling problems related to range, linearity, and low-frequency noise, Meyer and Amer9 introduced a much simpler technique for determining cantilever deflection in 1988: the optical beam detection (OBD) method.
Due to its simplicity and the unhindered optical view of the cantilever and sample, which was not available in initial interferometric AFMs, the OBD method rapidly became the default detector for most commercial AFMs.
The OBD technique exhibits a theoretical noise floor equivalent to interferometric AFMs10 and is constrained only by the shot noise of light to a few fm·Hz-½. However, practical limitations of the OBD method result in the noise floor being one or two orders of magnitude above this theoretical limit, even on state-of-the-art AFMs.
For instance, reaching the noise limit requires filling the full length of a cantilever with the OBD spot.11 This cannot be accomplished with a straightforward AFM design for all cantilever sizes, thereby restricting the noise performance optimization of an AFM to a specific cantilever length.
As for accuracy, the abundance of journal articles on the topic of calibration underscores the restrictions of the OBD technique in achieving accurate displacement and force measurements.12
The challenge with OBD accuracy is not solely quantitative. It is essentially restricted because OBD measures the angle of the cantilever, instead of the relevant metric in nearly all AFM experiments: the tip displacement.
Transforming an angular cantilever measurement into a tip displacement measurement necessitates assumptions about the cantilever’s mode shape. These assumptions are frequently violated in practice, resulting in inaccurate measurements.13
These real-world and essential restrictions of the OBD technique are well understood by AFM professionals, and recently led Asylum Research to release the Cypher IDS: an AFM integrated with an external laser Doppler vibrometer that directly measures the tip motion.14
Since its introduction, the IDS has become the “gold standard” in nanoscale electromechanical measurements, effectively addressing the challenging problems associated with materials science.15–19
It has also played a crucial role in improving long-standing spring constant and sensitivity challenges in AFM.20, 21
Despite these achievements, the IDS velocity signal exhibits noise at frequencies below 10 kHz, limiting its widespread use in general AFM applications.
Building on the IDS and leveraging decades of experience in designing and applying quantitative nanoscale science, Asylum Research has taken the next step in AFM with the introduction of Vero—the first commercial AFM to integrate a QPDI detector.
Principles of QPDI Design
The Vero AFM QPDI detector is inspired by two important principles that were adopted and substantially developed by Bellon et al. 22
The term “Differential” in QPDI pertains to the principle of preserving a common optical path for both the measurement and reference light beams. In Vero, the reference beam reflects on the back of the cantilever chip, as illustrated in Figure 2, positioned within 1 mm of the measurement beam near the cantilever tip.
This design guarantees that the cantilever’s displacement is measured in relation to the stationary cantilever chip, effectively reducing low-frequency noise resulting from drift and vibration between the measurement and reference beams.
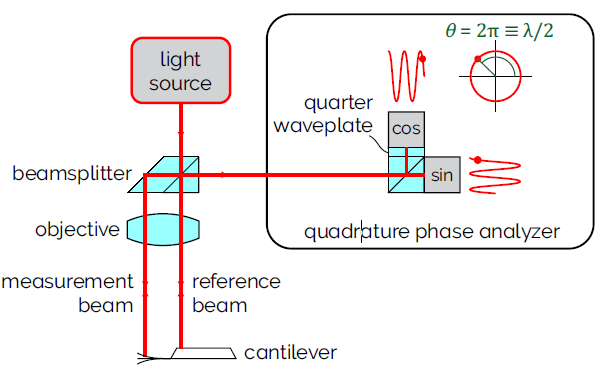
Figure 2. Diagram of the QPDI principle used to measure cantilever displacement in a Vero AFM. A light beam is split into two beams that are focused onto the cantilever and the backside of the chip. A quadrature phase analyzer measures the difference in the distance traveled by both beams to determine the displacement of the cantilever. A full 2π cycle in phase is equivalent to a _ /2 displacement, and multiple cycles may be measured. Image Credit: Asylum Research – An Oxford Instruments Company
The term “Quadrature Phase” in QPDI refers to a principle that involves generating a second interferometric signal with a 90 ° phase delay compared to the first signal. This is achieved by using a quarter waveplate, as shown in Figure 2.
This approach guarantees that when one signal’s sensitivity reaches zero (at the peak and trough of the sine wave), the other signal delivers maximum sensitivity, and vice versa.
Calculating the arctangent of the two signals allows the extraction of the phase between the light beams that reflected off the cantilever and its chip.
The measured phase can be directly converted into a displacement in nanometers, leveraging the high accuracy of the known wavelength of light.
The quadrature scheme not only linearizes the measured cantilever displacement across a full interferometric cycle but also enables the detector to unwrap a limitless number of cycles despite the finite range of the photodetectors measuring the two signals.
This means that the range of the quantifiable motion extends from the sub-picometer noise floor of the interferometer to many microns, accommodating even the most extreme situations in AFM.
No Crosstalk between Vertical and Lateral Forces
This section compares the QPDI and OBD methods in a straightforward experiment involving a large force curve on silicon, as illustrated in Figure 3. The QPDI force curve demonstrates ideal behavior akin to a theoretical simulation, while the OBD force curve exhibits markedly different behavior.
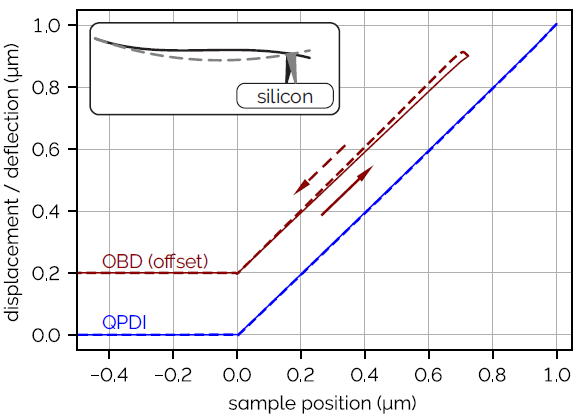
Figure 3. Force curve using an Adama 2.8-AS cantilever on a silicon sample with a large deflection range. In-plane forces cause hysteresis in the OBD-measured force curve that relates to the rotation of the cantilever rather than the tip displacement. The inset shows how the cantilever end can rotate between approach and retract which is incorrectly measured by OBD deflection signal as hysteresis. QPDI measures tip displacement directly, with no measurable hysteresis. Image Credit: Asylum Research – An Oxford Instruments Company
In both force curves, the in-plane frictional forces between the tip and the sample result in a rotation of the cantilever’s end. During this approach, it bends slightly downward, and during the retract portion, it bends slightly upwards.23
This rotation introduces an apparent hysteresis in the OBD-measured force curve, which does not accurately represent the true motion of the tip. In contrast, the QPDI-measured force curve displays a nearly perfect overlap between the approach and retraction.
It directly measures the actual displacement of the cantilever tip, with no measurable agreement between the tip and silicon surface throughout the force curve, resulting in the expected unity slope.
Although intriguing physics phenomena arise from in-plane forces, it is undesirable to mix these forces with the interactions occurring perpendicular to the sample, as seen in OBD. Conversely, the QPDI detector offers an accurate measurement of the perpendicular tip displacement without such crosstalk.
Improved Measurement Sensitivity
For OBD, the light spot size can be adjusted to facilitate the utilization of small cantilevers or reduce the noise floor on large levers, but not both. Even under optimal conditions, a noise floor below 20 fm·Hz-½ is considered excellent, achieved only with short cantilevers.
In contrast, the Vero AFM’s light spot has a diameter of approximately 3 µm, making it compatible with nearly all standard levers. Since the QPDI noise performance is independent of matching the spot size to the cantilever size, it consistently achieves a typical noise floor below 10 fm·Hz-½ on cantilevers, regardless of their size.
The QPDI and OBD approaches are compared in images of the piezoresponse of ErMnO3, as illustrated in Figure 4, captured using the same Spark™ 70 Pt (NuNano) cantilever at the same location. This cantilever, typical for electromechanical measurements, has a length of about 225 µm and a free resonance of around 70 kHz.
The single-frequency-PFM signal measured by OBD is obscured under noise (Figure 4a). To address this issue, a common method is to use dual AC resonance tracking (DART),24–26 where the contact resonance intensifies small signals (Figure 4b).
Despite resolving sensitivity issues, DART is still an OBD technique, suffering from substantial crosstalk between in-plane and out-of-plane motion. Consequently, it is a priori impossible to distinguish the orientation of the grains using any OBD technique.
In contrast, the image of single-frequency-PFM measured by QPDI (Figure 4c) accurately represents the vertical motion of the sample without crosstalk.
As evident in Figure 4, QPDI can differentiate between grains that are in-plane and out-of-plane. Notably, the DART image shows a seemingly out-of-plane response in grains whereas the QPDI image does not.
DART faces an additional challenge in that quantifying cantilever sensitivity in the proximity of resonance is very difficult.
The amplitude range in Figure 4b relies on a sub-resonant calibration factor related to the angular motion of the cantilever, as opposed to the vertical motion of the tip. In contrast, the QPDI image offers an accurate measurement of the vertical motion of the tip across all locations in the image.
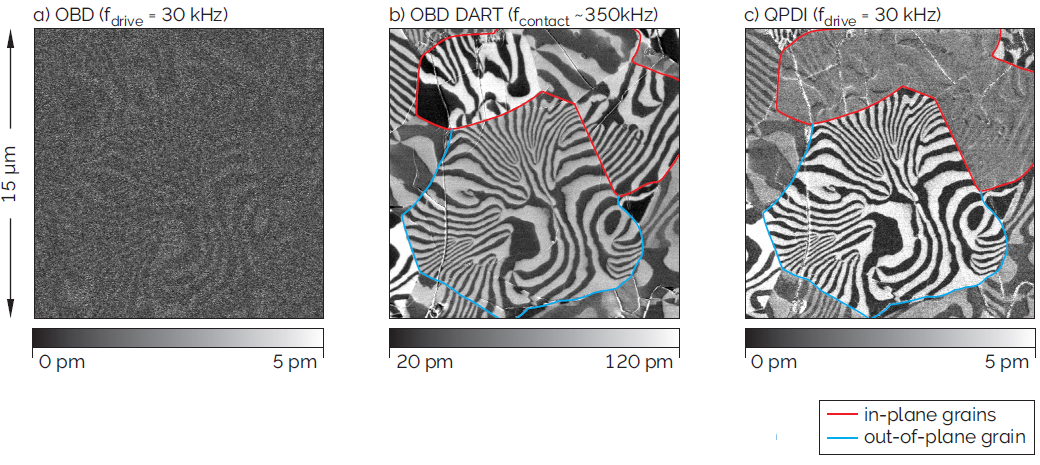
Figure 4. The piezoresponse amplitude of the polycrystalline ErMnO3 sample was measured in a) single-frequency PFM mode using OBD, b) DART PFM using OBD, c) single-frequency PFM mode using Vero with QPDI. The drive amplitude for all three images was fixed at 2 V. Sample provided by Jan Schultheiß and Dennis Meier, Norwegian University of Science and Technology. Image Credit: Asylum Research – An Oxford Instruments Company
Accurately Calibrated Stiffness and Tip Displacement
Although some research relies on qualitative AFM images, many AFM measurements can be made measurable by calibrating relevant signals. Tip displacement is one such important signal, utilized in many measurements and in the calibration of cantilever spring constants.
In this context, the significantly enhanced accuracy of QPDI provides advantages over OBD, which is challenging to calibrate. To validate the absolute accuracy of the QPDI detector, an absolute stiffness measurement was conducted on seven NIST-calibrated cantilevers.27
These levers underwent independent calibration utilizing a HeNe-based laser Doppler vibrometer and an electrostatic balance, showing excellent agreement.
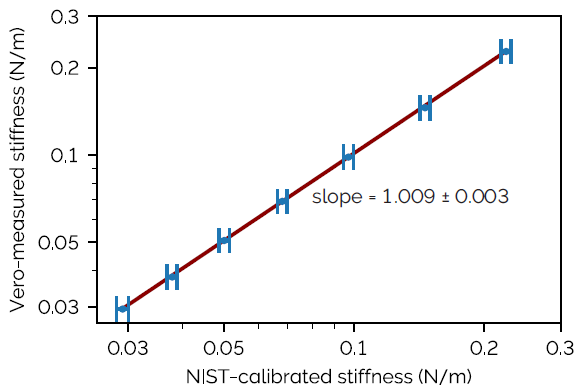
Figure 5. Stiffness measurement of 7 NIST-calibrated cantilevers using the Vero AFM showing absolute accuracy correspondence within 0.9 ± 0.3 %. The horizontal error bars represent combined expanded uncertainties provided by NIST. The error on the mean from repeated measurement for the Vero-measured stiffnesses is not shown since they are smaller than the marker size. Image Credit: Asylum Research – An Oxford Instruments Company
As shown in Figure 5, the stiffnesses measured by Vero were accurate within 1 % of the NIST-calibrated values (quantified deviation was 0.9 ± 0.3 %). This error falls well within the combined expanded uncertainty range provided by NIST for these cantilevers, ranging between 2.6 % and 3.0 %.
The deviation in stiffness below 1 % implies a corresponding deviation in the measured displacement of less than 0.5 %, showing that the wavelength of light serves as a reliable “meter stick” for consistent measurements across different interferometry-based instruments.
Summary
Vero is the inaugural commercial AFM employing QPDI cantilever sensing to directly measure the accurate vertical tip displacement. This measurement is achieved with a noise floor that is often more than 10 times lower than OBD, and it sidesteps the crosstalk between vertical and lateral tip forces associated with OBD.
By using interferometry, Vero ensures that displacements are precisely calibrated using the wavelength of the light. These benefits of QPDI make Vero AFM results more accurate and repeatable.
References and Further Reading
- Labuda, A., Pottier, B. & Bellon, L. US 11519935.
- Binnig, G., Quate, C. F. & Gerber, Ch. Phys Rev Lett 56, 930–933 (1986).
- Martin, Y., Williams, C. C. & Wickramasinghe, H. K. J. Appl. Phys. 61 4723 (1987).
- Schönenberger, C. & Alvarado, S. F. Rev. Sci. Instr. 60, 3131–3134 (1989).
- Rugar, D., Mamin, H. J. & Guethner, P. Appl. Phys. Lett. 55 2588 (1989).
- Den Boef, A. J. Appl. Phys. Lett. 55, 439–441 (1989).
- Cunningham, M. J., Cheng, S. T. & Clegg, W. W. Meas. Sci. Technol. 5, 1350–1354 (1994).
- Goto, K., Sasaki, M., Okuma, S. & Hane, K. Rev. Sci. Inst. 66, 3182–3185 (1995).
- Meyer, G. & Amer, N. M. Appl Phys Lett 53, 1045–1047 (1988).
- Putman, C., Degrooth, B., Vanhulst, N. & Greve, J. Ultramicroscopy 42–44, 1509-1513 (1992).
- Schäffer, T. E. Nanotechnology 16, 664–670 (2005).
- Butt, H.-J., Cappella, B. & Kappl, M. Surf Sci Rep 59, 1–152 (2005).
- Labuda, A. & Proksch, R. Appl Phys Lett 106, (2015).
- Labuda, A., Walters, D., Cleveland, J., Proksch, R. US 9804193.
- Lu, H. et al. ACS Mater Lett 3136–3141 (2023).
- Cheema, S. S. et al. Nature 580, 478–482 (2020).
- Liu, Y. et al. Nat Mater 17, 1013–1019 (2018).
- Zhang, Z. et al. Adv. Mat. 33, (2021).
- Lipatov, A. et al. NPJ 2D Mater. Appl. 6, 18 (2022).
- Labuda, A. et al. Rev. Sci. Instr. 89, (2018).
- .Labuda, A. et al. Rev. Sci. Instr. 87, (2016).
- Bellon, L., Ciliberto, S., Boubaker, H. & Guyon, Optics Communications 207, (2002).
- Hoh, J. H., Engel, A. & Muller, M. E. Langmuir 9 (1993).
- Rodriguez, B. J., Callahan, C., Kalinin, S. V & Proksch, R. Nanotechnology 18, 475504 (2007).
- Proksch et al. US 8555711.
- Proksch et al. US 8024963.
- Gates, R. S. Certification of Standard Reference Material® 3461 Reference Cantilevers for AFM Spring Constant Calibration. (2023)

This information has been sourced, reviewed, and adapted from materials provided by Asylum Research – An Oxford Instruments Company.
For more information on this source, please visit Asylum Research – An Oxford Instruments Company.
