


Highly Oriented Pyrolytic Graphite (HOPG) is a widely used substrate in Scanning Probe Microscopy (SPM) research, valued for its exceptional flatness, uniformity, and well-ordered layered structure.
Beyond its physical qualities, HOPG has been extensively employed as a model electrode for the development and optimization of electrocatalytic materials and reactions that play a crucial role in energy conversion processes.1-4
Studying its electrochemical behavior provides key insights into the fundamental mechanisms of electrocatalysis, which in turn supports the design of more efficient catalysts for a broad range of applications.
On a microscopic level, the basal plane and edge regions of the HOPG surface exhibit heterogeneous electrochemical and electrocatalytic properties due to inherent differences in their electronic and structural characteristics.5
To investigate this surface heterogeneity, Scanning Electrochemical Microscopy (SECM) has traditionally been used. SECM enables visualization of localized electrochemical processes by employing a microelectrode probe to measure activity at specific regions, offering useful information about electrocatalytic performance.6
However, Scanning Electrochemical Cell Microscopy (SECCM) builds on this capability by providing significantly higher spatial resolution. This allows for even more localized insight into electrochemical behavior.
SECCM operates by forming a small electrolyte meniscus at the tip of a pipette, which serves as both the probe and an electrochemical cell. This design enables precise delivery of reactants to defined surface areas.7-10
In this study, electrochemical heterogeneity across the HOPG surface was visualized using a customized SECCM setup developed in collaboration with Park Systems. This system enabled the simultaneous acquisition of both topographical and electrochemical activity maps.
The experiments were conducted using grade 2 HOPG, which offers intermediate quality suitable for both high-resolution imaging and broader practical use. A series of electrochemical maps were collected at various applied potentials by operating SECCM in AC mode, as previously demonstrated.11,12
Experimental
Chemicals and Materials
All solutions were prepared at 25 °C utilizing ultrapure H2O sourced from a Milli-Q water purification system, which has a resistivity of 18.2 MΩ·cm (Millipore Corp.). The chemicals utilized, including potassium chloride (KCl, VWR Analytical), were employed as received. The substrate employed in the experiments was HOPG grade 2 (SPI).
The ruthenium hexamine redox couple was acquired from Sigma-Aldrich and maintained at room temperature prior to use.
Fabrication and Utilization of Dual Barrel Probes
Theta borosilicate capillaries (O.D. 1.2 mm, I.D. 0.9 mm) were converted into nanopipettes (I.D. 50-70 nm, O.D. 150-200 nm) utilizing a CO2 laser puller (P-2000, Sutter Instruments). The dimensions of the pipette were verified using SEM (FEI Quanta 600F).
The pipettes were filled with designated solutions, including 100 mM KCl and 5 mM Ru(NH3)6Cl3. Two Ag/AgCl wires were placed into each barrel of the pipette, functioning as quasi-reference counter electrodes (QRCEs).
Instrumentation for SECCM
The SECCM system, featuring a dual-barrel configuration, was developed on the Park NX12 AFM model platform,11,12 integrating a custom-built potentiostat. The current readings acquired from the potentiostat were input into the Aux channel of the AFM controller.
The current readings were essential for ensuring a consistent distance between the probe tip and the HOPG sample surface during the SECCM measurements.
To ensure stable SECCM cyclic voltammetry (CV) mapping operations and measurements, a custom-built humidity chamber was utilized to maintain humidity levels within the range of 20-40 %. The SECCM measurement was conducted in collaboration with the Baker Lab at the Department of Chemistry, Texas A&M University.
Results and Discussion
The operational principles of the SECCM instrumentation have been comprehensively detailed in earlier publications by the Unwin group.7-10 The essential component is a dual-barrel probe that has been symmetrically fabricated.
The significance arises from the role of the electrolyte meniscus within an SECCM setup, which acts as a small-scale electrochemical cell.
The size of this meniscus generally resides within the attoliter range, and its dimensions are closely associated with those of the probe tip, which typically measures between 150-250 nanometers in outer diameter (Figure 1).
The vertical perspective disclosed the actual configuration of the dual-barrel probe within an ecliptic structure (Figure 1a and 1b). The dual-barrel probes that were extracted exhibited a linear ohmic response between the two barrels utilized in SECCM measurements (Figure 1c).
Figure 1. SEM images of the dual barrel probe, a vertical view (a), and a side view (b), which shows the approximate diameter of the probe-tip as 200 nm. The corresponding ohmic response of the dual barrel probe (c) was measured after filling it with 100 mM KCl and applying a potential range of -0.4 V to + 0.4 V. The resulting resistance was determined to be approximately 1 GΩ. Image Credit: Park Systems
To guarantee safe and consistent contact of the meniscus with the substrate, which functions as the working electrode, the researchers carefully monitored the ionic current in both DC and AC components. Upon the contact of the meniscus with the substrate, a potential sweep (V1) was started from 0 to -0.5 V to obtain cyclic voltammograms.
The desired potential difference was attained by applying ± V1/2 to two Ag/AgCl electrodes using the potentiostat. Consequently, the effective potential (Vwe) at the substrate, in relation to the Ag/AgCl electrodes, was roughly -V1.
The electrochemical current signal (iwe) produced at the working electrode was precisely documented (Figure 2a) utilizing the integrated current amplifier of the AFM.
The researchers conducted a comparison of two CVs acquired at distinct scan rates of 10 and 50 mV/s, utilizing the Ru(NH3)62+ /Ru(NH3)63+ redox couple through nanoscale cyclic voltammetry, enabled by the dual barrel SECCM setup.
The CVs displayed a typical steady-state current pattern that is characteristic of ultramicroelectrodes, and notably, they appeared nearly identical, indicating that the electrochemical response remains consistent irrespective of the scan rate (Figure 2b).
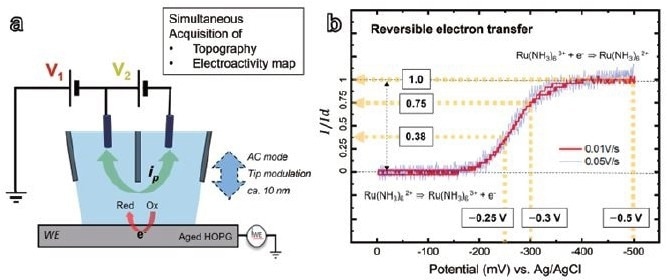
Figure 2. Dual barrel SECCM diagram of the system configuration (a) and SECCM cyclic voltammograms (b)with 5 mM Ru(NH3)6Cl3 (redox couple), 25 mM KCl (reference electrolyte), substrate (WE): HOPG, probe tip diameter: ~ 200 nm, ionic current 24 pA / 100 mV (V2). Image Credit: Park Systems
Simultaneous and correlative SECCM topography and electroactivity images of HOPG during reversible electron transfer measurements with ruthenium hexamine were successfully acquired (Figure 3). The lateral image resolution achieved was comparable to the diameter of the dual-barrel probe tip.
This indicates that the electrolyte meniscus did not extend to the substrate surface during the measurement when the applied potential was present. Measurements were conducted at working electrode potentials of -0.25, -0.3, and -0.5 V vs Ag/AgCl to investigate the potential-dependent electroactivity.
The findings indicated that increased applied potentials were associated with enhanced electroactivity at both the step edges and the basal plane.
At the step edge, the electroactivity was observed to range from 8 to 22 pA (maximum), whereas at the basal plane, it ranged from 5 to 15 pA (maximum), as indicated by the line profile analysis (Figure 4).
SECCM facilitated the correlative data analysis regarding the characterization of electroactivity that is dependent on position (or thickness).
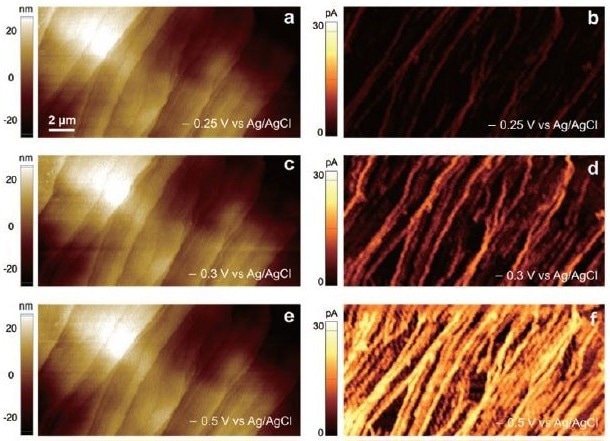
Figure 3. SECCM Topographies (a,c,e) and SECCM electroactivity maps (b,d,f) of HOPG. The reduction of Ru(NH3)63+ of the same area was measured by applying different potentials of – 0.25 V (b), – 0.30 V (d), and – 0.50 V (f) vs Ag/AgCl. The probe diameter was ca. 200 nm and the probe was modulated by 10 nm to operate in AC mode SECCM. 5 mM Ru(NH3)6CL3 was filled into both barrels of the probe with 25 mM KCl as reference electrolyte. Typical acquisition times were xxx s/image. Image Credit: Park Systems
The comprehensive analysis involved comparing line profiles concerning thickness and faradaic current at seven distinct step edges (Figure 4). This method enabled us to define the diverse electroactivity, represented as the faradaic current for each individual layer of graphene.
The estimated quanti ty of single graphene layers varied between 6 and 30. Through a direct comparison of topography and faradaic current, the researchers assessed the variation in electroactivity at individual step edges on the HOPG surface. Distinct potential-dependent effects were noted in each localized region (Figure 4b).
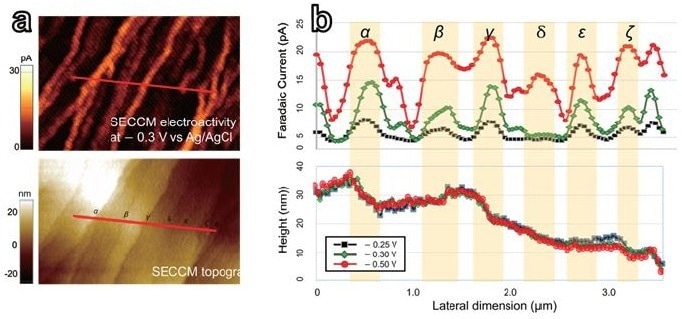
Figure 4. Selected linear area of SECCM electroactivity map (top) and topography (bottom) of HOPG for line profile comparison (a). The line profiles of both were extracted from the red lines above from each at three different potentials of – 0.25 V, – 0.3 V, and – 0.5 V vs Ag/AgCl. (b)correlative profile comparison of selected line data extracted from electroactivity map and corresponding topography at three different potential levels. A total of seven step-edges(α-η) were chosen along the selected line (the red bar in (a)). Image Credit: Park Systems
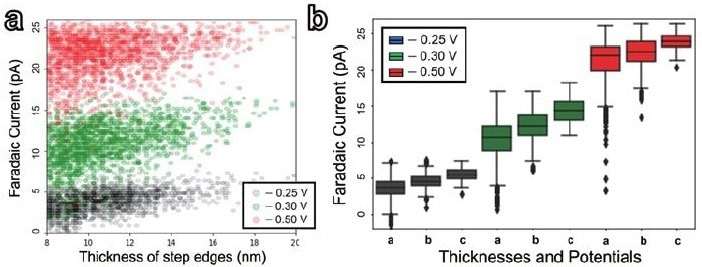
Figure 5. Statistical distribution of the faradaic current at step edges in the range of 8 to 20 nm for three different potentials: – 0.25 V, – 0.3 V, and – 0.5 V vs Ag/AgCl. (a) individual data plots, (b) Box-and-whisker plot depicting the statistical relationship between the thickness of step edges (a: 8-12 nm, b: 12-16 nm, c: 16-20 nm) and three different potentials: – 0.25 V (gray), – 0.3 V (green),and – 0.5 V (red) vs Ag/AgCl. The data are presented in Table 1. Image Credit: Park Systems
Table 1. Statistical analysis of the calculated electroactivity in different thickness levels and potential range. Source: Park Systems
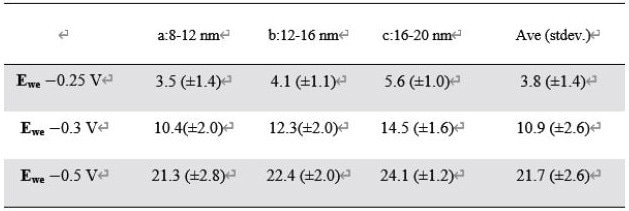
The electroactivity of step edges on HOPG was examined through the application of statistical analysis. The analysis concentrated on step edges exhibiting a thickness between 8 nm and 20 nm.
The dataset comprised 1727, 1902, and 1870 data points for the electroactivity map at potentials of -0.25 V, -0.3 V, and -0.5 V, respectively (Figure 5a).
A box-and-whisker analysis indicated a distinct trend: as the step edges thickened, the electroactivity rose, while the variation in electroactivity diminished. This trend was consistently observed across all three potentials (Figure 5b and Table 1).
Conclusion
The dual-barrel SECCM system has demonstrated its value as a tool for electrochemistry researchers using a custom-designed potentiostat. This method facilitates simultaneous imaging of high-resolution topography and electroactivity, while efficiently containing the electrolyte during measurements with applied potential.
This study demonstrated a distinct correlation between elevated applied potentials and enhanced electroactivity at both step edges and the basal plane of HOPG within the model system utilized. The examination of thickness-dependent electroactivity provided significant insights, allowing us to estimate the number of individual graphene layers.
This study has shown that dual barrel SECCM serves as a valuable instrument for electrochemistry researchers, enhancing the comprehension of electrocatalysis and its possible applications in catalyst development and energy conversion processes.
Acknowledgments
Based on materials originally authored by Myung-Hoon Choi, Hanaul Noh, Lane A. Baker, and Stefan B Kaemmer from Park Systems Inc.
References
- Banerjee, S., et al. (2005). Conductivity landscape of highly oriented pyrolytic graphite surfaces containing ribbons and edges. Physical Review B, 72(7). https://doi.org/10.1103/physrevb.72.075418.
- Ma, H., et al. (2014). Scanning Tunneling and Atomic Force Microscopy Evidence for Covalent and Noncovalent Interactions between Aryl Films and Highly Ordered Pyrolytic Graphite. The Journal of Physical Chemistry C, 118(11), pp.5820–5826. https://doi.org/10.1021/jp411826s.
- Pham, K.D., et al. (2018). Layered graphene/GaS van der Waals heterostructure: Controlling the electronic properties and Schottky barrier by vertical strain. Applied Physics Letters, 113(17), p.171605. https://doi.org/10.1063/1.5055616.
- Zhang, Y., Ren, J., Zhang, X., He, Y., Zhang, Z., Fan, J., Wang, Z. and Qu, X., 2020. Multiscale Superstructures via Self‐Assembly of DNA Origami and Abiotic Nanoparticles. Angewandte Chemie International Edition, 59(13), pp.5357–5361. https://doi.org/10.1002/anie.201910514
- Jaouen, K., et al. (2017). Localized electrochemistry for the investigation and the modification of 2D materials. Applied Materials Today, (online) 8, pp.116–124. https://doi.org/10.1016/j.apmt.2017.05.001.
- Nikoloz Nioradze, Chen, R., et al. (2015). Organic Contamination of Highly Oriented Pyrolytic Graphite As Studied by Scanning Electrochemical Microscopy. Analytical Chemistry, 87(9), pp.4836–4843. https://doi.org/10.1021/acs.analchem.5b00213.
- Snowden, M.E., et al. (2012). Scanning Electrochemical Cell Microscopy: Theory and Experiment for Quantitative High Resolution Spatially-Resolved Voltammetry and Simultaneous Ion-Conductance Measurements. Analytical Chemistry, 84(5), pp.2483–2491. https://doi.org/10.1021/ac203195h.
- Patel, A.B., et al. (2012). A New View of Electrochemistry at Highly Oriented Pyrolytic Graphite. Journal of the American Chemical Society, 134(49), pp.20117–20130. https://doi.org/10.1021/ja308615h.
- Chi, S., et al. (2012). Definitive Evidence for Fast Electron Transfer at Pristine Basal Plane Graphite from High-Resolution Electrochemical Imaging. Angewandte Chemie International Edition, 51(22), pp.5405–5408. https://doi.org/10.1002/anie.201200564.
- Zhang, J. and Kim, B. Park AFM Application Note #48
- Choi, M., et al. (2020). Probing Single-Particle Electrocatalytic Activity at Facet-Controlled Gold Nanocrystals. Nano Letters, 20(2), pp.1233–1239. https://doi.org/10.1021/acs.nanolett.9b04640.
- Jeong, S., et al. (2022). Unraveling the Structural Sensitivity of CO2 Electroreduction at Facet-Defined Nanocrystals via Correlative Single-Entity and Macroelectrode Measurements. Journal of the American Chemical Society, 144(28), pp.12673–12680. https://doi.org/10.1021/jacs.2c02001.

This information has been sourced, reviewed and adapted from materials provided by Park Systems.
For more information on this source, please visit Park Systems.
