


Darker-colored samples commonly demonstrate significant light absorption, resulting in diminished intensity and fluctuations in scattered light during dynamic light scattering tests. As a result, it becomes imperative to dilute the sample to ensure precise results.
This article uses the BeNano 180 Zeta Pro to analyze the particle size of two samples in aqueous solutions with light-absorbing effects.
Instrumentation
The BeNano 180 Zeta Pro features a 671 nm solid-state laser with a power of 50 mW. Dynamic light scattering (DLS) is performed by collecting scattered light signals from the sample at 90° or 173°. The calculation of intensity fluctuation yields the correlation function from which the diffusion coefficient can be derived. Utilizing the Stokes-Einstein equation, the size and size distribution of the sample are determined.
Experiment
Both samples in this investigation showed brown coloration, indicating strong light absorption. Particle size analysis was performed on two samples under various circumstances, including stock solutions and subsequent dilutions (2×, 10×, and 100×).
All measurements were taken at 25 °C ±0.1 °C using the 90° and 173° optics. The repeatability of the results was assessed by measuring each sample three times.
Results and Discussion
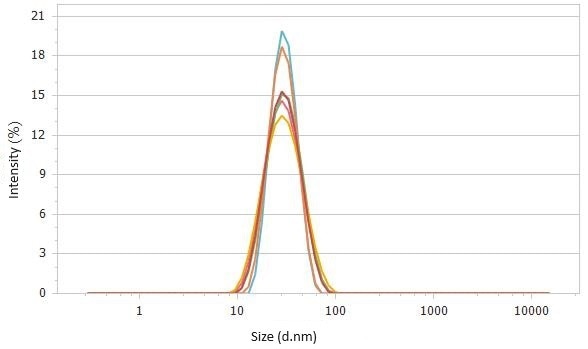
Figure 1. Correlation functions (top) and size distributions (bottom) of 2× diluted sample #1 detected at 90°. Image Credit: Bettersize Instruments Ltd.
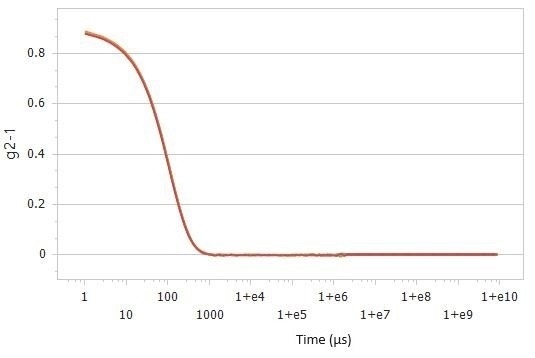
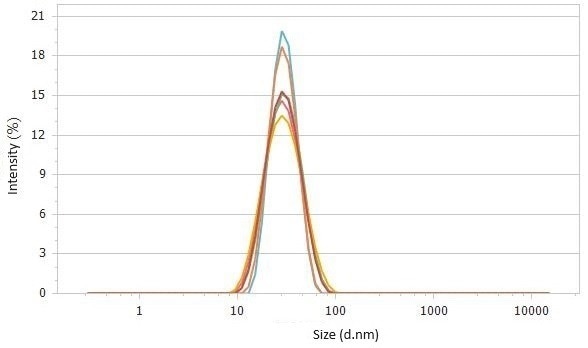
Figure 2. Correlation functions (top) and size distributions (bottom) of 2× diluted sample #2 detected at 90°. Image Credit: Bettersize Instruments Ltd.
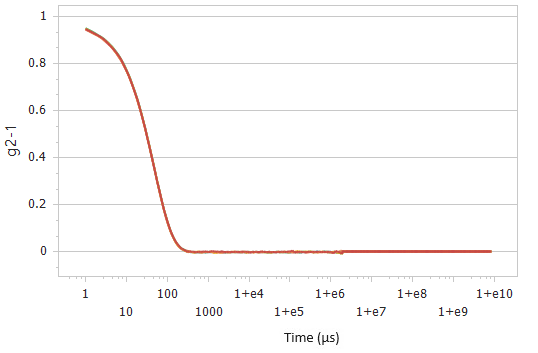
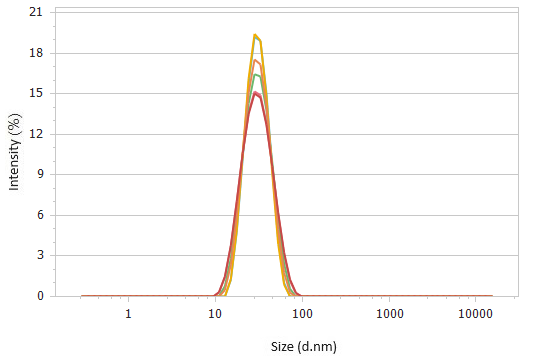
Figure 3. Correlation functions (top) and size distributions (bottom) of 2× diluted sample #1 detected at 173°. Image Credit: Bettersize Instruments Ltd.
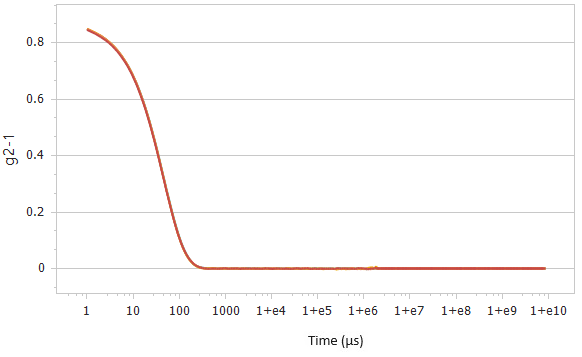
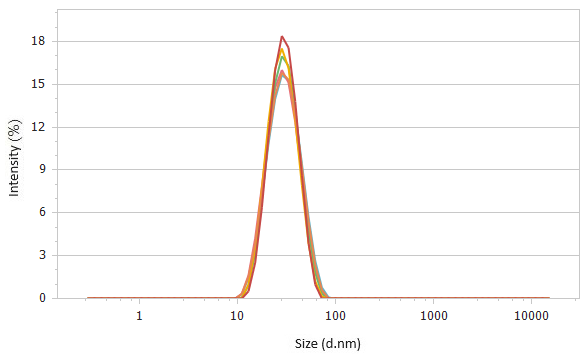
Figure 4. Correlation functions (top) and size distributions (bottom) of 2× diluted sample #2 detected at 173°. Image Credit: Bettersize Instruments Ltd.
Figures 1–4 show consistent test results for both samples at varying concentrations and angles. The stock solution cannot be observed at a 90° optics angle due to the sample’s high absorption.
Table 1. Size results of sample #1. Source: Bettersize Instruments Ltd.
| Sample #1 | 90° | 173° |
|---|---|---|
| Dilution Factor | Z-average Size | Z-average Size |
| 0 | — | 45.90 ± 0.23 |
| 2 | 29.74 ± 0.4 | 28.50 ± 0.12 |
| 10 | 26.11 ± 0.91 | 25.61 ± 0.08 |
| 100 | 25.86 ± 0.23 | 25.71 ± 0.11 |
Table 2. Size results of sample #2. Source: Bettersize Instruments Ltd.
| Sample #2 | 90° | 173° |
|---|---|---|
| Dilution Factor | Z-average Size | Z-average Size |
| 0 | — | 34.38 ± 0.1 |
| 2 | 24.21 ± 0.44 | 24.93 ± 0.24 |
| 10 | 22.68 ± 0.2 | 22.98 ± 0.26 |
| 100 | 23.18 ± 0.24 | 22.55 ± 0.16 |
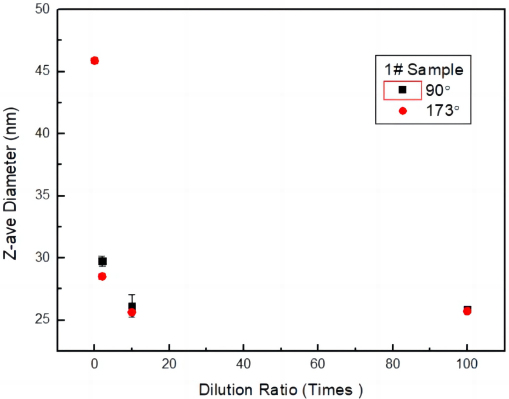
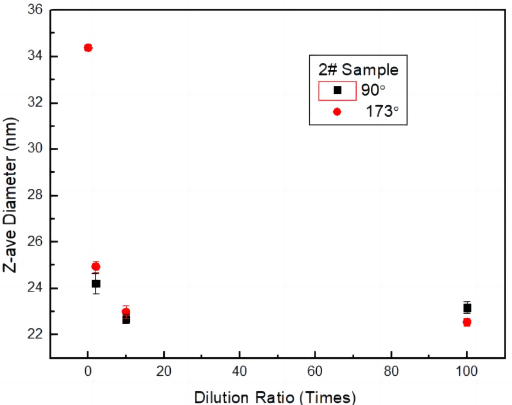
Figure 5. Z-average sizes of sample #1 (top) and #2 (bottom) obtained at different dilution ratios and at different detection angles. Image Credit: Bettersize Instruments Ltd.
Figure 5 shows a concentration-dependent reduction in size when measured at 90° and 173°. After a tenfold dilution, there are no additional size changes with concentration. The findings at 90° and 173° show consistent agreement under dilution conditions.
The size increases with concentration, primarily due to the sample’s pronounced absorption of scattered light. This absorption diminishes the intensity and fluctuations in scattered light, thus yielding larger results. Consequently, dilution is indispensable for samples displaying substantial absorption. However, within the dilution range of 10 to 100 times, the particle size remains stable, indicating minimal absorption of scattered light and thereby ensuring the accuracy of the size results.
Conclusion
Utilizing different detection angles, specifically 173° and 90°, revealed that the results obtained at 173° were not closer to the true value at higher concentrations. This is due to the fact that backscattering (173°) has the benefit of suppressing multiple light scattering for substances with large concentrations, such as milky white samples.
Backscattering, however, is unable to improve detection capabilities at high concentrations for samples with substantial absorption. Therefore, rather than depending exclusively on instrument configurations, users are recommended to take their sample characteristics into account when choosing instrument specifications and detection angles.

This information has been sourced, reviewed and adapted from materials provided by Bettersize Instruments Ltd.
For more information on this source, please visit Bettersize Instruments Ltd.
