


The primary objective in the realm of electrocatalysis and energy storage is to establish a correlation between electrochemical activity and nanostructured electrochemical interfaces, known as electrodes.1
Image Credit: ShutterStock/Auhustsinovich
However, measuring the diversity of electrode structures and exploring the relationship between local structure and activity for these interfaces using conventional macroscopic electrochemical methods can be rather challenging.
This is due to the limitations of macroscopic electrochemical studies, which can only measure the overall electron transfer across an entire sample. To address this issue, a new approach is required to analyze nanoscale electrochemical activity.
Scanning electrochemical cell microscopy (SECCM) is an innovative nano-electrochemical scanning technique designed to study the localized electrochemical properties of electrode surfaces.1-4
This method involves a quasi-reference counter electrode (QRCE) placed within a nano pipette filled with an electroactive substance. By lowering the nano pipette using the AFM (atomic force microscope) Z-scanner and forming a meniscus at the contact surface, a small droplet or nano electrochemical cell is created.
When a bias is applied between the QRCE and the working electrode on the XY scanner, the electroactive substance in the droplet undergoes an electrochemical reaction. A map of electrochemical currents is generated by collecting multiple cyclic voltammograms at different positions.
SECCM allows researchers to conduct numerous confined nano-electrochemical measurements (with droplet areas ranging from nm² to µm²) on a single surface,5 enabling high-throughput experimentation.
Researchers can easily modify chemical systems by swapping out one pipette for another containing a different electroactive substance, minimizing the need for special sample preparation.
Pipette preparation is straightforward and cost-effective. The data is easy to interpret: higher currents indicate a greater rate of electrochemical reaction in the examined region.
These advantages position SECCM as an appropriate solution for analyzing the electrochemical characteristics of individual platinum nanoparticles3 or correlating localized electrocatalytic activities with the specific structures on polycrystalline electrode surfaces.5-6
In this study, the researchers record the electrochemically reversible redox process of [Ru(NH3)6]3+/2+ on a highly-ordered pyrolytic graphite (HOPG) surface using the Park NX12 AFM system. All Park NX systems can serve as platforms for SECCM.
A glass nanopipette equipped with an Ag/AgCl QRCE is employed, building on prior success in commercialized pipette-based electrochemical microscopy.7 Park Systems’ hardware and software enable measurements of localized nanoscopic cyclic voltammetry each time the meniscus makes contact with the surface.
As a result, the Park NX12 generates spatially-resolved surface electroactivity maps of HOPG with high throughput at the micro- and nanoscale.
This research underscores the effectiveness of Park Systems’ commercial SECCM option for quantitative electroanalysis on the nanoscale. This capability could also facilitate the rational design of functional electromaterials with potential applications in energy storage (battery) studies and corrosion research.
Experimental
Potassium chloride (KCl) and hexaammineruthenium (III) chloride ([Ru(NH3)6]Cl3) from Sigma-Aldrich are used without any modifications. A solution containing 0.0155 g of [Ru(NH3)6]Cl3 and 0.037 g of KCl is mixed in 10 mL of deionized (DI) water. This mixture results in an electrolyte solution with concentrations of 5 mM for [Ru(NH3)6]Cl3 and 50 mM for KCl.
The highly-ordered pyrolytic graphite (HOPG) sample is the working electrode that was cleaved using the “scotch tape method” before usage.8
In all SECCM experiments within the Park NX12 system, separate XY and Z piezoelectric scanners are employed to control the movement of the pipette and the sample. The SECCM investigations are carried out using the Park Systems SmartScanTM software.
Figure 1 illustrates the schematic of the SECCM setup. A glass nano pipette with an opening diameter of around 100 nm, made by pulling a borosilicate capillary, is filled with an electrolyte solution (5 mM [Ru(NH3)6]Cl3 + 50 mM KCl).
An Ag/AgCl electrode is then placed in the pipette, serving as the Quantum Redox Current Electrode (QRCE). The filled pipette is fixed onto the Park SICM head and positioned over the HOPG electrode surface. A current amplifier within the SICM head, integrated into the Park NX12 system, facilitates current measurement.
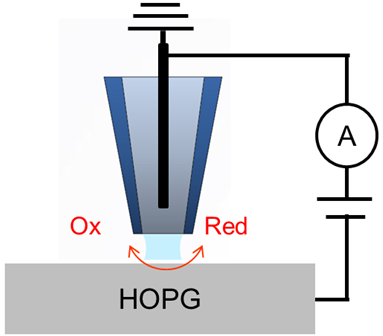
Figure 1. Schematic illustration of SECCM configuration with a single channel pipette.
Image Credit: Park Systems
The SECCM mode includes five windows and panels that enable the operator to manage the nanoelectrochemical process (Figure 2). In the initial step, a liquid meniscus forms as the pipette approaches the sample, essentially acting as a nanoscale electrochemical cell.
Using the visual display, the operator can assess the distance from the tip end to the sample surface (Figure 2A). During the approach, a potential bias of (-0.5 V) is applied to the sample surface. The current log channel records the current across the meniscus (Figure 2B).
Changes in this current serve as signals to adjust the Z scanner’s movement until a meniscus forms without making contact with the substrate. When the probe meniscus comes into contact with the surface, the Z scanner halts, and a reduction reaction occurs within the confined droplet at the designated potential.9
The current within the pA range is identified by comparing it to the background fA current in the air. The current log channel in Figure 2B indicates that this sudden current change leads to a current spike. This refers to the alteration in current versus time in the current log file when the meniscus forms and a reduction reaction takes place.
Once the pipette comes into contact with the droplet, the operator can gauge the electrochemical activity at the specified position using the I/V spectroscopy mode, obtaining a single linear cyclic voltammogram.
Within the control panel (Figure 2C), the operator can input the desired experimental conditions, including sample bias voltage, sweep rate, cycle repetitions, and output channels.
The cyclic voltammograms (CVs) for the Ru (NH3)6]3+/2+ redox reaction are executed on the HOPG surface at different scan rates, achieved by applying a sample bias voltage ranging from -0.5 V to 0 V. In the Position section (Figure 2D), the operator can utilize the “Point List” function to designate the location for obtaining the individual CV curve.
The “Point Grid” function allows the operator to perform I/V spectroscopy repeatedly across a predetermined surface area, creating an image of the electrochemical activity. This function is referred to as the Approach-Retract-Scanning (ARS) mode.10
As the pipette lands at various predefined grid positions using AFM, linear CVs are recorded each time a meniscus forms. Finally, the acquired CV is displayed in the “Data View” panel (Figure 2E).
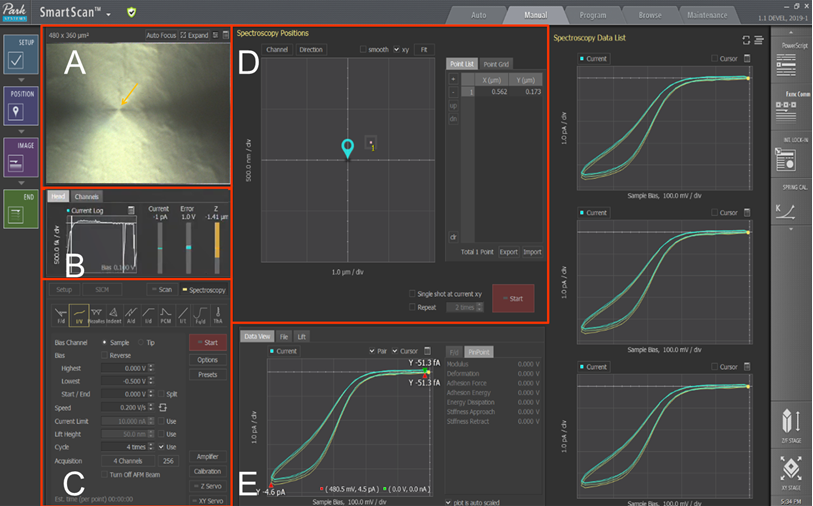
Figure 2. SECCM Mode in Park SmartScanTM software. (A) Vision & Monitoring view. (B) Current monitor panel. (C) I/V spectroscopy parameter control panel. (D)Spectroscopy positions control panel for point list or point grid function. (E) Data viewing panel.
Image Credit: Park Systems
Results and Discussion
During their SECCM experiments, a glass nanopipette featuring an approximate 100 nm-diameter tip opening, filled with a solution of 5 mM [Ru(NH3)6]Cl3, is affixed onto the SICM head. This assembly is then positioned above the HOPG electrode surface.
To gain a microscopic understanding of the electron transfer process of [Ru(NH3)6]3+/2+ on HOPG, an LSV scan is conducted in the range of 0 V to -0.5 V and then back to 0V.
This bias range is determined based on the CV curve of the bulk macroscopic redox reaction of [Ru(NH3)6]3+/2+. Figure 3 illustrates a typical SECCM LSV curve depicting the reduction process of [Ru(NH3)6]3+.
The observed smooth sigmoidal wave pattern is a characteristic feature of the LSV obtained in SECCM format.11 This pattern corresponds to a quasi-steady-state voltammogram, with the steady-state limit current reaching about -5.3 pA at a sample voltage of -0.5 V.
The small current magnitude detected underscores the sensitivity of Park Systems’ low-noise current detector. The redox reaction is reversible: the reduction of [Ru(NH3)6]3+ occurs as the potential sweeps from 0 V to -0.5 V, and oxidation takes place as the potential sweeps back from -0.5 V to 0 V.
![Single SECCM LSV acquired with a glass nanopipette filled with 5 mM [Ru(NH3)6]Cl3. The LSV is recorded at a sweep rate of 10 mV/swith an initial potential at 0 V](https://d1otjdv2bf0507.cloudfront.net/images/Article_Images/ImageForArticle_6538_1692934810418845.png)
Figure 3. Single SECCM LSV acquired with a glass nanopipette filled with 5 mM [Ru(NH3)6]Cl3. The LSV is recorded at a sweep rate of 10 mV/swith an initial potential at 0 V.
Image Credit: Park Systems
![Four overlaid SECCM LSVs in 5 mM [Ru(NH3)6]3+ and 50 mM KClat a sweep rate of 200 mV/s](https://d1otjdv2bf0507.cloudfront.net/images/Article_Images/ImageForArticle_6538_16929348289621196.png)
Figure 4. Four overlaid SECCM LSVs in 5 mM [Ru(NH3)6]3+ and 50 mM KClat a sweep rate of 200 mV/s.
Image Credit: Park Systems
The SECCM LSV shows strong consistency and durability. Figure 4 displays four typical LSV curves obtained from HOPG using a faster scan rate of 200 mV/second. There is little variation between the consecutive CVs.
The limit current value (-4.6 pA) is quite similar to Figure 3, indicating that the nano electrode’s CV response is not influenced by scan rate.
However, as the system lacks a true steady state, there is a slight broadening of the curve at the bottom left of Figure 4. This is due to increased charging current at higher scan rates.
Voltammetry measurements are taken at different points using the ARS mode to explore position-dependent electrochemical behavior. After the first LSV, the Z scanner moves the nano pipette a few micrometers up from the surface’s initial point.
The XY scanner then moves horizontally to a specific distance. The Z scanner is lowered again until it makes electrical contact with the surface. This process is repeated to get multiple LSV curves across the scan area.
As a proof-of-concept, ten LSVs are collected from ten neighboring positions to create an image of electrochemical activity. This is depicted as an electrochemical current map in Figure 5A, which plots the current measured at a fixed potential of -0.5 V vs. Ag/AgCl.
Different colors in the image represent variations in current within about a 1pA range across the scan area. Individual full CV curves at positions 1 and 2 are shown in Figures 5B and 5C, respectively.
The similar electrochemical response is because the nano pipette touches a flat surface instead of an edge.2 More structured studies are planned to link surface structures with electrochemical activity.
![(A) Electrochemical current maps at -0.5 V vs Ag/AgCl on HOPG surface. Image is generated from a series of LSVs taken with the same nanopipette filled with 5 mM [Ru(NH3)6]3+ and 50 mM KCl. The scan rate is 10 mV/s with the bias voltage starting from 0 and swept to -0.5 V vs Ag/AgCl.(B)& (C) Individual LSVs taken at position 1 and 2](https://d1otjdv2bf0507.cloudfront.net/images/Article_Images/ImageForArticle_6538_16929348469535271.png)
Figure 5. (A) Electrochemical current maps at -0.5 V vs Ag/AgCl on HOPG surface. Image is generated from a series of LSVs taken with the same nanopipette filled with 5 mM [Ru(NH3)6]3+ and 50 mM KCl. The scan rate is 10 mV/s with the bias voltage starting from 0 and swept to -0.5 V vs Ag/AgCl. (B)&(C) Individual LSVs taken at position 1 and 2.
Image Credit: Park Systems
Conclusions
This article examines the simplicity of the initial commercial SECCM in evaluating nanoscale electroactivity mapping using the Park NX12 system and advanced SmartScanTM software.
A highly reproducible and robust detection of an electrochemically reversible [Ru(NH3)6]3+/2+ redox process on the HOPG surface is observed, with a current limit as low as a few pA.
The utilization of ARS mode showcases position-dependent electrochemical current mapping. The results suggest that SECCM represents the latest advancement in nanoscale electroanalysis, which thus has the potential to support advanced studies in energy storage.
References
- Güell, A. G., Ebejer, N., Snowden, M. E., Macpherson, J. V., & Unwin, P. R. (2012). Journal of the American Chemical Society, 134(17), 7258-7261.
- Güell, A. G., Cuharuc, A. S., Kim, Y. R., Zhang, G., Tan, S. Y., Ebejer, N., & Unwin, P. R. (2015). ACS nano, 9(4), 3558-3571.
- Gao, R., Edwards, M. A., Qiu, Y., Barman, K., & White, H. S. (2020). Gao, R., Edwards, M. A., Qiu, Y., Barman, K., & White, H. S. (2020).Journal of the American Chemical Society, 142(19), 8890-8896.
- McKelvey, Kim, et al. “Nanopipettes as a tool for single nanoparticle electrochemistry.” Current Opinion in Electrochemistry 6.1 (2017): 4-9
- Bentley, Cameron L., Minkyung Kang, and Patrick R. Unwin. Analytical Chemistry 92 (2020): 11673−11680
- Wang, Yufei, Emma Gordon, and Hang Ren. Analytical Chemistry 92.3 (2020): 2859-2865.
- Shi, W., Goo, D., Jung, G., Pascual, G., Kim, B., & Lee, K. Simultaneous Topographical and Electrochemical Mapping using Scanning Ion Conductance Microscopy–Scanning Electrochemical Microscopy (SICM-SECM).
- Novoselov, K. S.; Geim, A. K.; Morozov, S. V.; Jiang, D.;Zhang, Y.; Dubonos, S. V.; Grigorieva, I. V.; Firsov, A. A. Science 2004, 306, 666−669.
- Bentley, Cameron L., David Perry, and Patrick R. Unwin. Analytical chemistry 90.12 (2018): 7700-7707.
- Ushiki, Tatsuo, et al. Micron 43.12 (2012): 1390-1398. [11] Snowden, M. E.,A. G. Güell,S. C. S. Lai,K. McKelvey,N. Ebejer,M. A. O’Connell,A. W. Colburn,P. R. Unwin, Anal. Chem., 2012, 84, 2483-2491.

This information has been sourced, reviewed and adapted from materials provided by Park Systems.
For more information on this source, please visit Park Systems.
