


Conventional nanoparticle size analyzers utilize the dynamic light scattering (DLS) technique. This method involves illuminating samples with a laser beam and detecting scattered light fluctuations resulting from the Brownian motion of particles suspended in a liquid.
The initial intensity fluctuation over time undergoes processing through correlation calculations to derive the correlation function. Various mathematical models, including Cumulants, NNLS, or CONTIN, are employed to determine the size and size distribution.
DLS analyzers often operate in batch mode, which is a low-resolution mode for size distribution testing, particularly for widely distributed samples. Batch mode refers to the traditional testing method using quartz or plastic cuvettes.
Furthermore, only a narrow distribution with a 2.5–3 times difference in particle size can be distinguished between individual components at the highest precision of the size distribution calculation, which is highly algorithm-dependent. The size distribution results’ quantitative character is severely constrained by this.
In contrast, each effluent component’s size can be independently detected by DLS flow mode when it is connected to a front-end separation device. Every component of the effluent is ideally mono-dispersed or closely mono-dispersed, and signals collected by concentration detectors provide size distribution information with a resolution of up to 1.3:1, independent of algorithms.
This article elucidates the size distribution of bovine serum albumin (BSA) by connecting the BeNano 180 Zeta Pro to front-end SEC (Size Exclusion Chromatography) equipment.
Instrumentation
The BeNano 180 Zeta Pro used a 50 mW 671 nm laser to capture light scattering signals at 173°. The measurement was performed using a 27 μL low-volume flow cuvette. Analog signals from the front-end SEC device’s Refractive Index (RI) detector were captured using a BFC-1 signal collector.
Experiment
Before use, a 5 mg/mL BSA solution was made in PBS buffer, stirred electromagnetically for 10 minutes, and then passed through a 220 nm water-based filter. Using a RI detector, injection and separation were carried out via the front-end SEC. Separated components were then added to the BeNano for size measurement at a temperature below 25 °C.
Chromatographic Conditions
- Mobile Phase: PBS Buffer
- Flow Rate: 0.4 mL/minute
- Injection Volume: 100 uL
Results and Discussion
Figure 1. Intensity, RI, and Size Effluent Curves of BSA. Image Credit: Bettersize Instruments Ltd.
Figure 1’s effluent curves show that BSA has several peaks. Peaks between 8 and 10 minutes indicate distinct oligomers, whereas peaks at roughly 6 minutes reflect aggregate peaks. The monomer of BSA is represented by the last significant peak, which appears at about 10.5 minutes. The larger area of the primary peak implies that most of the protein exists as monomers.
The size effluent curve (red dots) shows decreasing particle sizes, which is consistent with SEC separation principles. This demonstrates the efficiency of the front-end SEC in sample separation and validates BeNano as a detector for acquiring particle size information for each effluent component.
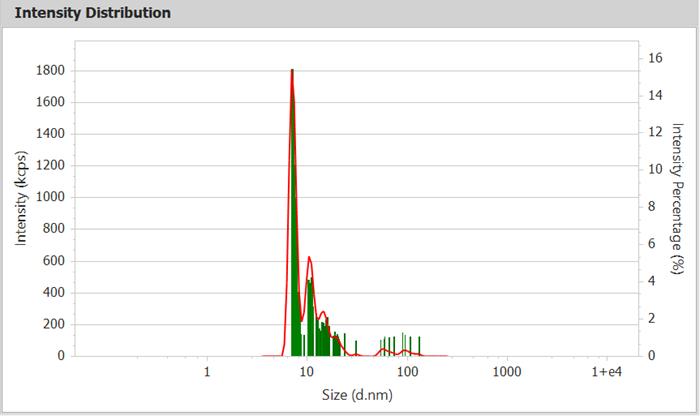
Figure 2. Intensity Distribution Curve of BSA (Bar Chart) Image Credit: Bettersize Instruments Ltd.
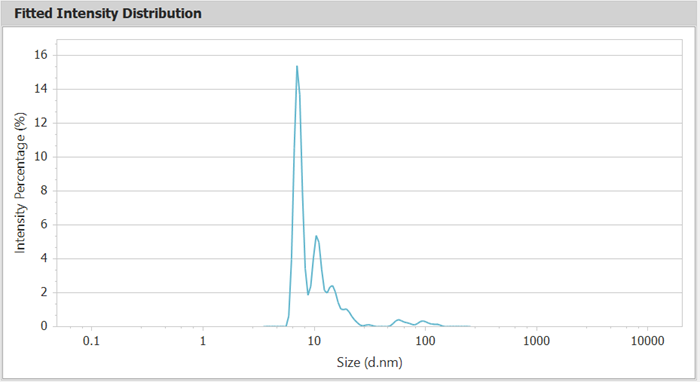
Figure 3. Intensity Distribution Curve of BSA (Line Chart). Image Credit: Bettersize Instruments Ltd.
Figures 2 and 3 show intensity distribution curves that clearly distinguish separated oligomers, with the monomer at 7.21 nm, which is consistent with the predicted size of BSA monomers (~7 nm). Table 1 lists the sizes and areas of the various effluent components.
Table 1. Measured distribution Peaks of BSA. Source: Bettersize Instruments Ltd.
| Size (d. nm) | Area (%) | Peak Std Dev (nm) | CV (%) | |
|---|---|---|---|---|
| Peak 1 | 7.21 | 57.42 | 0.61 | 8.49 |
| Peak 2 | 10.88 | 24.31 | 1.07 | 14.84 |
| Peak 3 | 15.49 | 10.29 | 1.44 | 19.98 |
| Peak 4 | 21.25 | 3.33 | 1.87 | 25.89 |
| Peak 5 | 31.19 | 0.35 | 1.91 | 26.50 |
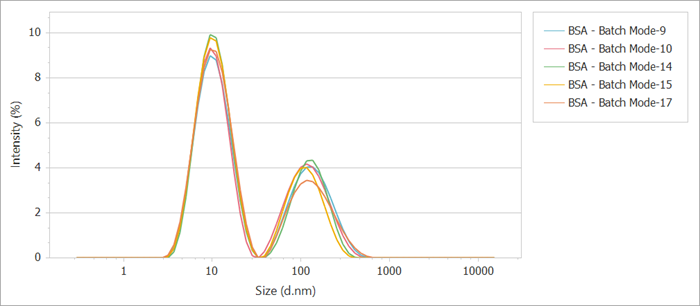
Figure 4. Batch-mode detection of the intensity distribution curve of BSA. Image Credit: Bettersize Instruments Ltd.
In batch-mode detection, the intensity distribution curve (Figure 4) exhibits only two peaks. The smaller peak (around 10 nm) corresponds to the size distribution of monomers, dimers, trimers, and other oligomers, whereas the larger peak (around 100 nm) signifies larger aggregates.
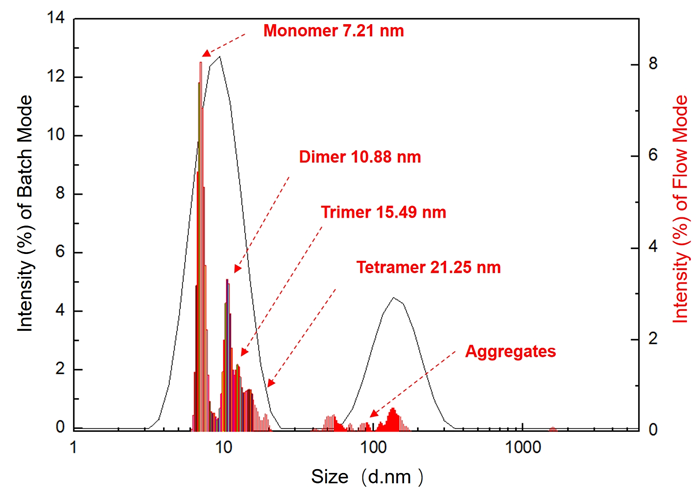
Figure 5. Comparison between batch-mode (line chart) and flow mode (bar chart) intensity distribution curves. Image Credit: Bettersize Instruments Ltd.
Figure 5’s comparison of the batch-mode and flow mode detection findings shows that the flow mode is capable of effectively detecting oligomer components that have extremely small size differences inside the small size peaks.
Conclusion
The goal of using the BeNano with flow mode as a detector in combination with a front-end separation device is to significantly enhance size measurement resolution. This article effectively showcased the potential of BeNano flow mode in the field of high-resolution size measurements by measuring BSA and demonstrating its detection capability.

This information has been sourced, reviewed and adapted from materials provided by Bettersize Instruments Ltd.
For more information on this source, please visit Bettersize Instruments Ltd.
