


Although all DLS-based analysis systems have the same fundamental approach to measuring particle size, they sometimes produce slightly different results for the same sample. This is a well-known consequence of each instrument’s unique optical setup and algorithms. To understand the magnitude and direction of such differences, we must first understand what a DLS is based on and what parameters affect the final result.
Image Credit: InProcess-LSP
What Happens During a DLS Measurement?
In a DLS measurement, particles diffusing by Brownian motion scatter incident light back to a detector, where interference of the light scattered by every particle occurs. This signal fluctuates with particle motion, and it is from these fluctuations that particle size information is obtained.
Importantly, the intensity of light scattered by each particle population will determine its relative weight in the intensity-based measurement: highly scattering particles (i.e., larger particles) will have increasingly more weight.
How Optical Setups Influence the Result
The key to comparing data from multiple systems is that even though the particles of a suspension always diffuse the same way, using various optical setups will result in different acquired signals and particle size measurements.
This is the consequence of a few but relevant phenomena:
- The optical models used by each system to interpret the collected data will influence the results. This is relevant because particles of different sizes scatter light differently in a setup-dependent manner. Light scattering for the submicron particle range shows two regimes. Small particles (Rayleigh regime) have a simple behavior, and larger particles scatter more intensely. From a given particle size (which depends on the incident wavelength), we enter the Mie regime, in which the scattering behavior becomes complicated: bigger particles can scatter less than particles a bit smaller, and vice versa.
- The scattering behavior differs per scattering wavelength. If two DLS machines use different wavelengths, the contributions of each particle size to the total signal will be different. This means that different populations will have differing weights on the particle size distribution, and therefore differences will arise when computing the average particle size.
- The scattering signal differs per signal collection angle. The intensity-based particle size distribution will differ even for two systems identical in wavelength, but collecting the scattered signal at a different angle. Each particle size scatters differently to different angles.
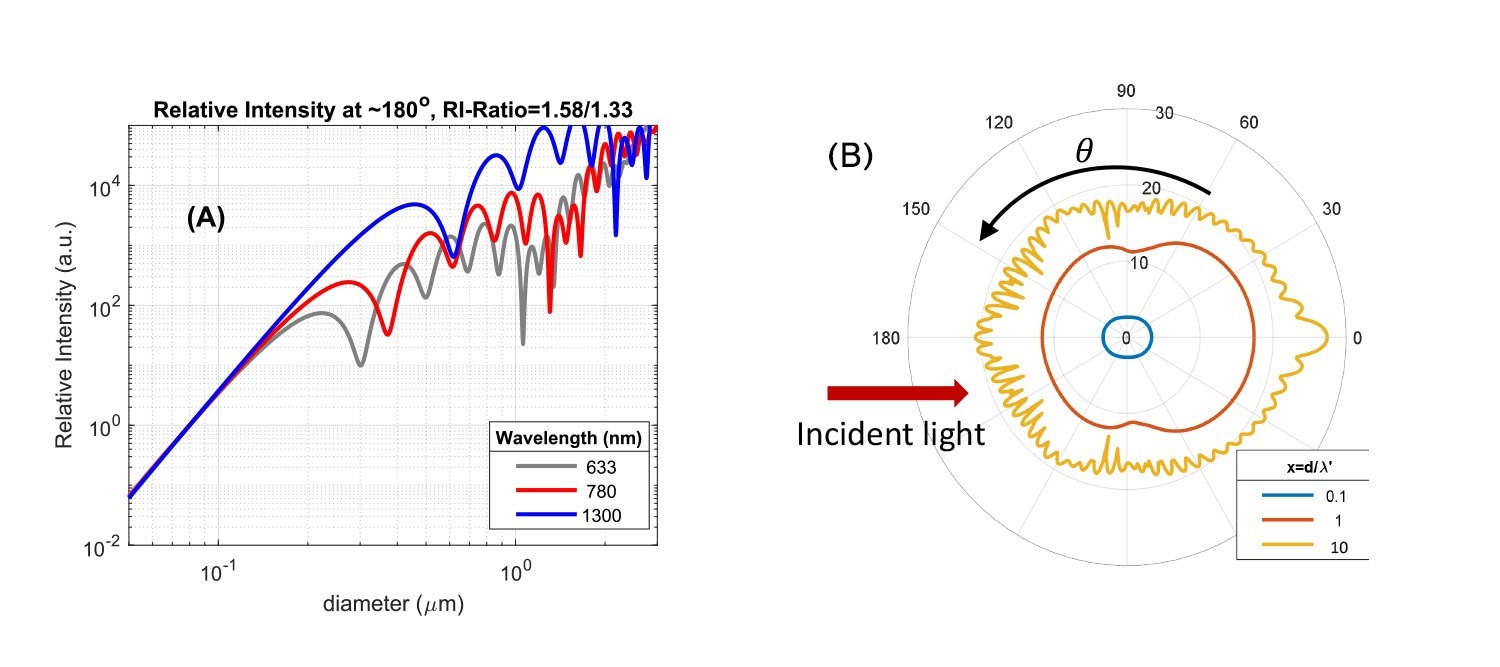
Fig. 2A: Scattered light intensity as a function of particle size, shown for three detection angles. The measurement uses a light wavelength of 633 nm and a refractive index ratio of 1.58/1.33. 2B: Scattering patterns at different angles for a single particle, based on Mie theory. Shown are three particle sizes relative to the light wavelength (size ratio = d/λ’). The refractive index of particle vs. solvent is 1.58/1.33. The red arrow shows the direction of the incoming light. Image Credit: InProcess-LSP
Why Results Differ Between Systems
With these three ideas in mind, it is easy to understand that each DLS-based system will have slightly different results, as all of them use slightly different wavelengths, collection angles, and algorithms. In other words, any change in the optical setup will slightly change the relative contributions of each particle population to the measured size distribution.
The same particle size measurements should be used only for extremely monodisperse samples. For polydisperse samples, be it wide distributions of multimodal samples, the measurements will differ for each machine, as different particle sizes will contribute differently to the intensity-based measurements. All of them can be correct at the same time.
PDI in Context: Why it Also Varies
These considerations are also especially important when considering the intensity-based PolyDispersity Index (PDI). For some configurations, the same polydispersity will yield a broader-weighted distribution of scattering signals, which will show in the results as a higher PDI. However, both PDIs would be correct, as PDI (and particle size) need to be understood in the context of their measuring system.
How Can We Establish Reliable Comparisons Between Systems?
One way to compare measurements between DLS systems is to establish correlations between the different intensity-based measurements. For a given product, the differences in the obtained particle sizes between instruments will follow the effects described above, meaning that meaningful fingerprinting between measurements can be done. This framework allows for direct mapping of the results of different systems. It is ideal as it does not rely on further processing of the different intensity-based particle size distributions, making data interpretation easier.
Using Volume Conversions to Normalize Data
Another way to compare datasets is to perform volume conversions, leading to volume-based measurements. What does this mean? We have already discussed that scattering encompasses two regimes: Rayleigh and Mie. For a volume conversion, a dataset is reanalyzed, taking into account a mathematical model for the scattering distribution for the wavelength and collection angle of the system. In short, a volume conversion considers all the factors mentioned above. It leaves us with a dataset that describes the relative volumes of each population as opposed to their relative scattering intensity (refractive index of the solvent and particles required). Volume-based distributions should, in principle, be the same for all measurements.
However, a few things will still make the final datasets slightly different:
- Each system (and provider) will have their own optical models. Since it is not a “one model fits all” solution, the volume conversion can be slightly different for different instruments even for the same dataset with the same wavelength and angle.
- Each system will have better quality data for different particle ranges. This means that some equipment’s ranges will be slightly distorted, affecting the final measurement.
- Last, but not least, since each system operates at a different wavelength, the refractive index may be less precise or simply unknown for some wavelengths and some materials. This leads to approximations that may affect the conversion from intensity-based to volume-based particle size distributions.
Accept Differences, Understand the Context
When comparing datasets of different DLS systems, one should not expect to see the exact numbers for the particle size of PDI. Instead, it is essential to acknowledge that each system has its own physical parameters and optical models, which can make the intensity-based datasets quite different and even make the volume-based datasets slightly dissimilar.

This information has been sourced, reviewed and adapted from materials provided by InProcess-LSP.
For more information on this source, please visit InProcess-LSP.
